On this page
- A high CTR measures attention, not profit
- Problem 1: the audience clicks for reasons unrelated to buying
- Problem 2: the creative promises what the offer does not deliver
- Problem 3: the landing page breaks the promise the ad made
- Problem 4: the platform is optimising for the wrong conversion event
- Problem 5: the funnel leaks at a stage nobody is watching
- Problem 6: you scaled before one combination worked
- Problem 7: your reporting does not match what the business earned
- A one-page ad performance audit
- How to find your biggest leak in half an hour
- Turn the audit into your next creative test
- Frequently asked questions
An ad can win the click and still lose money. In the hypothetical comparison below, one ad has 2.5 times the click-through rate (CTR) of another and a 50% higher cost per purchase. If your ads get clicks but don't convert, our view is that the cause is rarely the click itself. It usually sits between the ad and the revenue.
Below are seven places that gap opens, with a half-hour audit to find yours. We also show where AdSmash, an AI ad creative platform, helps with the part you control most: making more distinct ads to test.
A high CTR measures attention, not profit
CTR is the share of impressions that become clicks. Cost per click (CPC) is spend divided by clicks. Neither says what happened after the click, and the platform rewards what you ask it to reward. According to Meta's June 2020 explainer on how its delivery system works, the system predicts a person's likelihood of taking the advertiser's desired action "based on the business objective the advertiser selects". Most clicks also end without a conversion: Unbounce's 2024 Conversion Benchmark Report found a median landing page conversion rate of 6.6% across industries.
In this illustrative example, two ads each get 1,000,000 impressions at a $10 CPM, so each spends $10,000, and the average order value is $60.
| Hypothetical example | Ad A | Ad B |
|---|---|---|
| CTR | 3.0% | 1.2% |
| Clicks | 30,000 | 12,000 |
| Click-to-purchase rate | 0.4% | 1.5% |
| Purchases | 120 | 180 |
| Cost per purchase (CPA) | $83.33 | $55.56 |
| Return on ad spend (ROAS) | 0.72 | 1.08 |
Our view is that CTR and CPC are diagnostics, not goals. Judge an ad by the cost of the outcome that earns money. Then use CTR to understand why.
Problem 1: the audience clicks for reasons unrelated to buying
A broad audience gives delivery room to find cheap clicks, and cheap clicks are not buyers. High-intent signals include a product search, a site visit, an add to cart or a past purchase, and the more of them an audience shares, the closer a click sits to a purchase.
Use Ads Manager's breakdowns to split results by audience, placement and age. A segment with high CTR, a cost per purchase worse than the account average and a large share of spend is your leak. Our view is that the fix is rarely "narrower targeting"; it is one message written for one segment.
Problem 2: the creative promises what the offer does not deliver
A creative that promises more than the offer delivers earns clicks that never convert. According to Meta's description of its ad auction, ad quality includes assessments of "withholding information, sensationalised language and engagement bait". For conversion the consequence is the same: the ad sets an expectation the offer does not meet.
Compare ad and offer on price, terms, the specific claim and the product shown. If any differs, the click came from a promise you did not keep.
One practical guard is to reuse the same product facts everywhere. AdSmash stores products, tone and hooks once as brand context and reuses them across generations, so a new ad starts from the facts the offer already states.
A hook that names who the product is for may lower CTR and raise the share of clicks that buy. Test it. Compare cost per purchase, not CTR.
Problem 3: the landing page breaks the promise the ad made
Message match means the first screen repeats the specific promise that earned the click: the same price without scrolling, the named product and not a category page, evidence for the claim near the headline, the same trial terms with no paid step first.
Speed is a second way to lose the click. A 2020 study by 55 and Deloitte, commissioned by Google, found that when every page in the mobile journey improved four speed metrics by 0.1 seconds, retail progression rose 3.2% from product list to product detail and 9.1% from product detail to add to basket. The data covered 37 brand sites and more than 30 million user sessions. Read it as direction, not a promise for your site.
If link clicks run well ahead of landing page views in Ads Manager, check load time and redirects before you rewrite the offer.
Problem 4: the platform is optimising for the wrong conversion event
The optimisation event is the action you tell the platform to find more of: choose a form submission and it finds people likely to submit a form, qualified or not.
Volume limits the choice. According to Meta's Business Help Center, you should optimise for conversions first when the goal is conversions (landing page view optimisation is for traffic goals), and an ad set needs about 50 or more of the conversion it is optimised for per week to have a chance at being effective. When the deepest event is too rare, Meta suggests landing page view optimisation as an alternative.
Our rule of thumb, not a Meta rule: optimise for purchase at about 50 or more purchases a week per ad set, for add to cart below that, and for landing page views when neither reaches 50.
Lead generation has the same problem: measure cost per qualified lead in your CRM, not cost per lead. Meta's Conversion Leads goal may yield higher-quality leads, but it is currently only compatible with instant forms. According to Google Ads Help, primary conversion actions are used for bidding while secondary actions are for observation only, so mark the action that earns money as primary.
Problem 5: the funnel leaks at a stage nobody is watching
Data from the Baymard Institute puts the average documented cart abandonment rate at 70.22%, compiled from 50 studies published between 2006 and 2025 with mixed methods (last updated September 2025). Most visitors leave somewhere in the funnel, so the question is which stage loses the most money. Take an illustrative campaign: $5,000 at a $0.50 CPC buys 10,000 link clicks. Of those clicks, 70% become landing page views, 10% of those add to cart, 40% of those start checkout and 30% of those purchase.
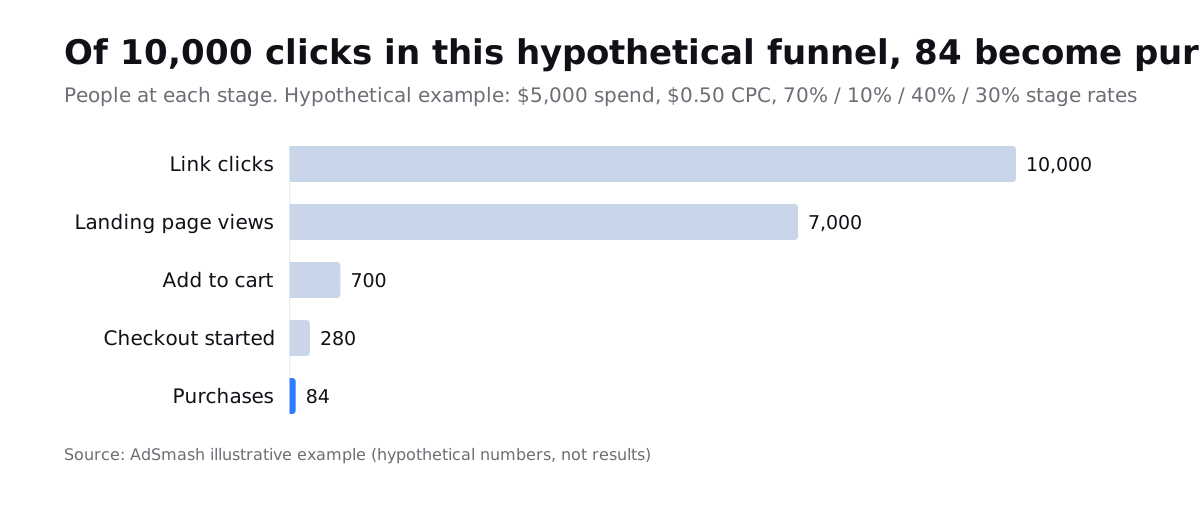
In the hypothetical funnel that is 84 purchases, a $59.52 cost per purchase and about $5,040 of revenue at a $60 average order value: a ROAS of 1.01.
Stage rates multiply, so a 20% relative improvement at any stage has the same effect. For example, lifting add to cart from 10% to 12% moves purchases from 84 to about 101 and cuts cost per purchase to about $49.60 (our calculation). Cost per person rises at each stage, from $0.71 per landing page view to $59.52 per purchase, so fix the leak cheapest to move, not automatically the biggest drop.
Problem 6: you scaled before one combination worked
A winning combination is one creative, one audience and one offer that produce purchases at an affordable cost, repeatedly. In our view, until you have one, more budget just buys more of the same result.
Scaling early is costly. According to Meta's Business Help Center, ad sets usually exit the learning phase after about 50 results in the week after the last significant edit, and while learning they are less stable and usually have a higher CPA. Meta defines a significant edit as a change such as the optimisation event, audience or creative.
At the hypothetical 1.01 ROAS, tripling spend at best triples a break-even result, and during learning CPA usually rises. How many ads a test needs is a separate question; see Creative hit rate: how many ads you need to find a winner. AdSmash's ad creative intelligence recognizes, dissects and improves on successful ads, which helps decide what to carry into the next variant.
Problem 7: your reporting does not match what the business earned
Platform conversion numbers and business revenue differ mainly because they credit sales differently. Attribution is the act of assigning credit for a conversion to the ads, clicks and other factors along a person's path, according to Google's Analytics Help. According to Meta's Business Help Center, its standard attribution settings credit click-through events within 1 day or 7 days after a link click and view-through events within 1 day after an impression, and results cannot be compared in the campaign overview table across ad sets with different attribution models.
Google differs again. According to Google Ads Help, Google Ads tracks clicks, whereas Google Analytics tracks visits, and conversion reporting can lag by 15 to 48 hours, especially for non-last-click attribution models.
Compare platform-reported conversions with store or CRM orders for the same period as a ratio, and watch it over time. Take an illustrative week: Meta reports 120 purchases, while the store shows 70 orders carrying Meta click-tagged UTM parameters. Platform purchases divided by store orders is 120 ÷ 70, about 1.7. We'd expect part of that gap by design, since UTM-tagged orders usually credit only the last tagged click.
A ratio that jumps usually points to a tracking or attribution-window change, not a performance change. Make scaling decisions on store revenue and margin.
A one-page ad performance audit
This is our own framework, not a platform standard. Answer the question in each box, write down the number, and mark the first stage whose red flag shows.
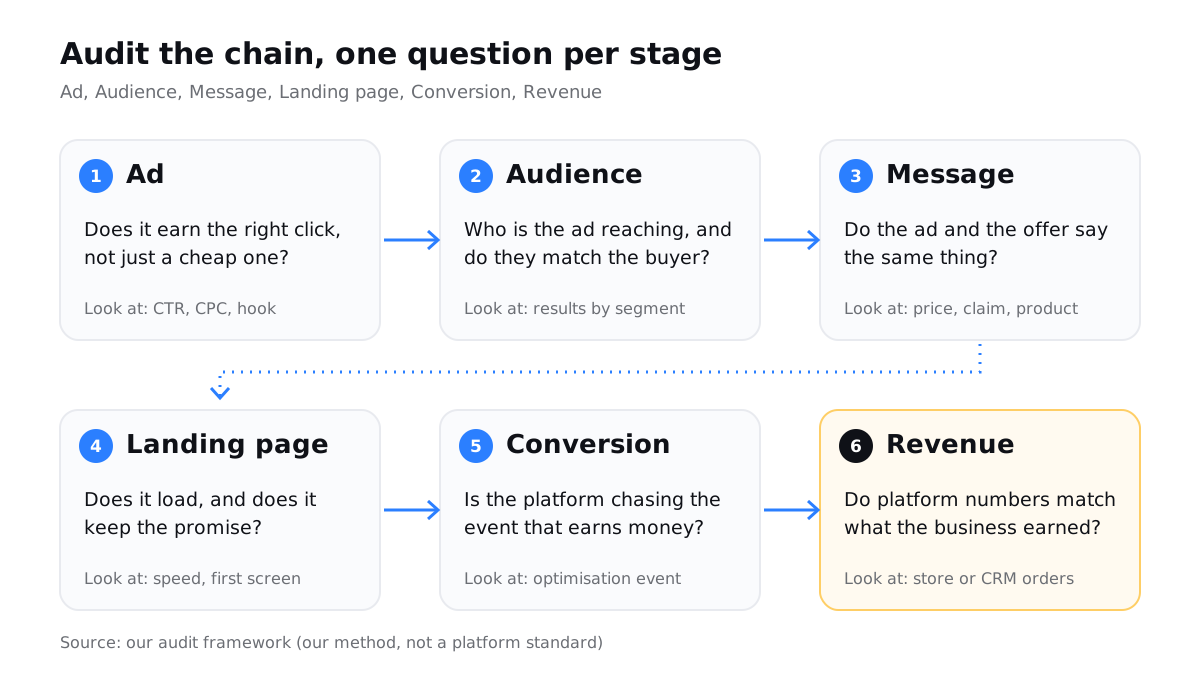
| Stage | Red flag |
|---|---|
| Ad | CTR high, cost per purchase above the account average |
| Audience | One segment holds most clicks and few purchases |
| Message | Price, claim, product or terms differ |
| Landing page | Landing page views well below link clicks |
| Conversion | The event is not the one that earns money, or gets fewer than about 50 results a week |
| Revenue | A ratio that jumps between periods |
How to find your biggest leak in half an hour
Check measurement first, because every later decision relies on it. A suggested schedule, for example for a single ad account:
- Minutes 0 to 5: compare platform conversions with store or CRM orders and note the ratio. If the platform shows almost none while the store shows orders, test the pixel or conversion event first.
- Minutes 5 to 10: write down each stage's rate from click to purchase, with last month's beside it.
- Minutes 10 to 15: open the ad on a phone, tap through, compare the promise with the first screen.
- Minutes 15 to 20: add the Last significant edit and Results columns; note each ad set's event, and flag any ad set below the roughly 50 results a week that Meta's Business Help Center says an ad set needs.
- Minutes 20 to 25: break out cost per purchase by audience, placement and creative.
- Minutes 25 to 30: write one hypothesis, one change, one metric and one review date.
Fix the earliest leak that is both measurable and cheap to test. Change one thing at a time.
Turn the audit into your next creative test
If the audit points at the audience, the message or the creative, the fix is usually more distinct ads to test, made from what you already know about your buyers. That is the job AdSmash is built for. Its ad creative intelligence breaks down winning ads and turns a teardown into a brief with one click, and it is available on every plan including Free. Your brand references are stored once and reused across generations, models from several providers sit on one canvas, and the cost is visible before every render. A read-only Meta connection brings campaign performance into the same workspace, so you can see which new ad moved cost per purchase.
Start free on AdSmash and build your next test from the leak you just found, or compare the plans. For the wider picture of how AI creative workflows run, read our guide to AI-generated advertising.
Frequently asked questions
What is a good conversion rate for a landing page?
According to Unbounce's 2024 Conversion Benchmark Report, the median conversion rate across all industries is 6.6% (based on more than 41,000 landing pages) and 3.8% for SaaS. Each page owner defines a conversion differently (a sign-up, a lead or a sale), so compare your own rate with your own history before any benchmark.